Institution
University of Maryland
Industry
Health Informatics
Team
3 members
Year
2022
My Role
User Research, Synthesis, Interaction Design, UI Design, Prototyping
Tools
Figma, Google Forms, TryMyUI, Wave
Platform
iOS, iPhone 13 Pro
At a glance
A campus app that incentivizes students to eat healthy
Students log their daily 2F-3V cups, earn coins for every cup, and spend those coins on produce their own university sells at a subsidised price. Mood logging and social leagues keep them in the loop long enough for the habit to hold.
55%
named availability and affordable prices as what would move them
Survey, n=20
60%
said they simply forget to eat fruit and vegetables
Survey, n=20
40%
shifted to processed and frozen food at college
Survey, n=20
10%
reach the five-cup target on a normal day
Survey, n=20
1 in 10
US adults get enough fruit or vegetables
CDC, 2017
9%
of US adults met vegetable intake recommendations in 2015
CDC, 2017
2.7M
lives that could be saved annually with sufficient intake
WHO / 5 A Day
5
prototype flows built: logging, reflection, social, cart, overall
Figma
01 - Research
Students already know. They cannot reach it.
Five public-health and peer-reviewed sources set the frame; a survey of 20 students aged 18-25, currently in school in the US, told us what actually gets in the way.
Nelson et al., 2008 - Obesity
Emerging adulthood is the window for establishing and intervening on long-term health behaviour patterns.
Conner et al. - PLOS ONE (RCT)
More fruit and veg improved psychological well-being: vitality and flourishing up; five longitudinal studies link higher intake to less depression.
Houghtaling et al., 2022 - IJERPH
Intake is disproportionately lower among socially and economically disadvantaged groups. The gap is structural, not informational.
- I rely more on processed and frozen food now40%
- I have become more aware of what I eat35%
- No major changes20%
- Irregular timings, not conscious of balanced nutrition5%
- 1-2 times50%
- 3-4 times35%
- 5 or more times a day10%
- I don't eat them5%
- Quality of food55%
- Meal timings25%
- None10%
- Quantity of food5%
- Number of meals per day5%
02 - Synthesis
The access-motivation gap
Motivation is high and behaviour is low. Everything between the two is structural, so that is where the product had to work.
01
Access, not knowledge
Nobody needed telling that vegetables are good for them. 55% named availability, 55% named price.
02
Processed is the default
03
Personal first, social second
75% chase personal goals; 30% respond to peer challenge. Social is an accelerant, not the engine.
04
The payoff must arrive early
Chronic disease is thirty years away; mood is not. The RCT evidence gave us a reward students can feel in a semester.
60%
forget to eat fruit and veg
→
Push nudge before the day is lost, plus a five-step tracker on the home screen
55%
blocked by price and availability
→
Coins redeemed for subsidised produce at the campus store
75%
driven by personal goals
→
A single visible target: 2 cups of fruit, 3 of vegetables, every day
30%
motivated by friendly competition
→
Duels and leagues on their own tab: opt-in pressure, never the front door
03 - Process
How the project ran
01
Secondary research
Five sources on emerging adulthood, intake disparities and CDC strategy.
02
Survey
20 US students, 18-25. Habits, frequency, barriers, motivators.
03
Synthesis
Four insights, the access-motivation gap, three How-Might-We statements.
04
Concept and IA
Log-to-Earn; five tabs: Home, Trends, Store, Social, Profile.
05
Flows and UI
Five flows: logging, reflection, social, cart, overall walkthrough.
06
Hi-fi prototype
Interactive iPhone 13 Pro prototype, entered from a lock-screen nudge.
07
Usability testing
Not yet run. The first thing this needs.
04 - Design
A day inside Eatopia
The whole product is one day repeated. The flow below is the walkthrough the prototype opens with.
4A - Increase intake
A day you read in one glance; a week you cannot hide from
The home screen answers one question first: how many cups are left today. Each completed cup shows the coins it earned, so the reward attaches to the behaviour we can actually influence.
The date strip is a row of rings, not a calendar; each day fills in proportion to the cups logged.
A push notification carries the nudge for the 60% who forget: "Hi Champ! Did you eat your 3rd cup yet?"

Home

Mood log
4B - Self-perception
An end-of-day check-in that does not punish a bad day
The app asks how the user felt about the day's goal and names the number they actually hit: "You completed 3 cups out of 5 today." Moods are multi-select.
"We know logging a low mood takes courage, but it will build your skills over time and inform you about your patterns and make you feel better."
Prototype copy. The reassurance sits in the prompt, not in a settings screen, because that is the moment the user decides whether to be honest.
4C - Affordability
Coins buy real produce; the institution pays the difference
This is what separates Eatopia from a tracker. The app connects universities with local farmers, following the CDC's farm-to-institution strategy, and sells that produce back to students at subsidised prices payable in coins.
Prices are quoted in coins, not dollars: Fresh Peach 20 coins a dozen; Avocado 120 coins for 3 lbs; Pineapple 10 coins.
Every student pays the same price regardless of background, which is the equal-access argument built into the pricing model.

Store

Social Corner
4D - Social motivation
Competition sized for the 30% who want it
The Social Corner splits into Duels and Leagues. A duel is head-to-head with an explicit goal and prize: 30-day challenge, 3+ cups for 30 days, 200 coins. A league is a self-formed group of three or more, ranked inside the institution.
Wins pay out in coins, so competition strengthens the core loop instead of running beside it.
The leaderboard is scoped to the campus, 219 participants at UMD, which keeps the comparison plausible rather than global.
05 - Reflection dashboard
Showing students the link between what they ate and how they felt
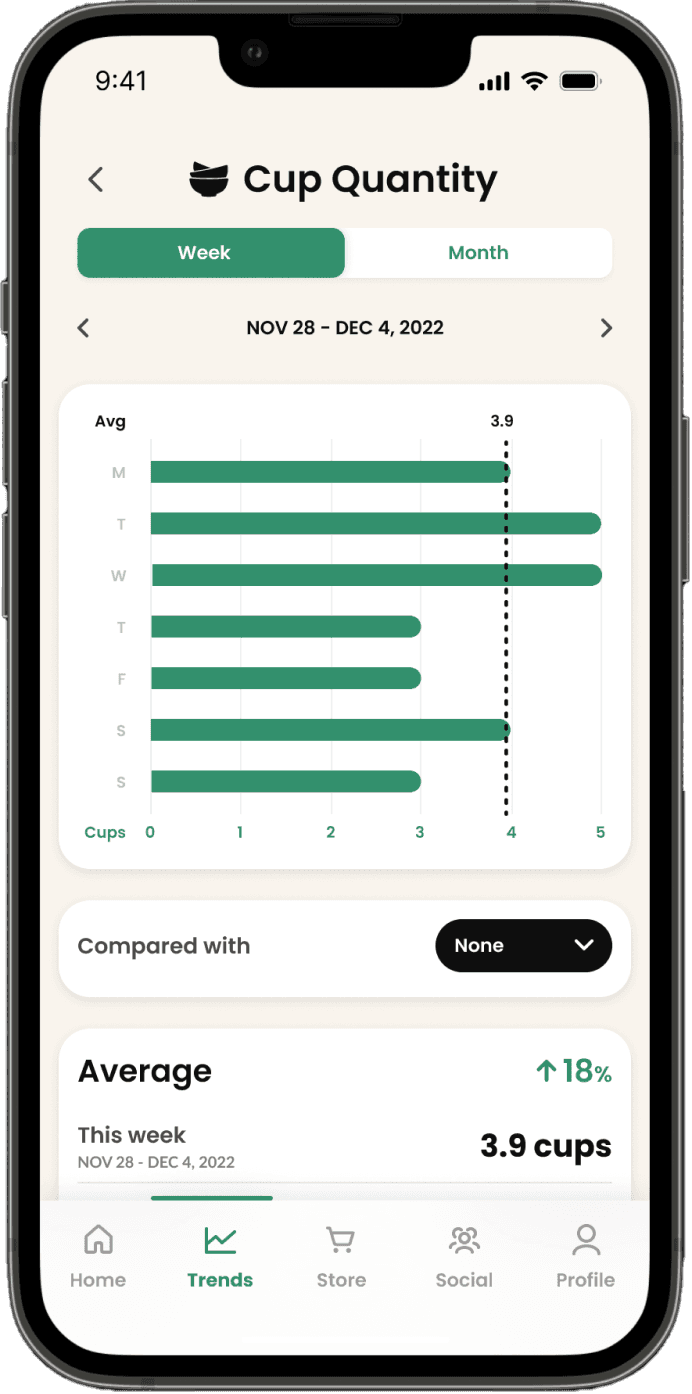
Three views under the Trends tab, each answering a question a student can only answer with a week of their own data.
Cup quantity
This week set against last week, so the number carries a direction: 3.9 cups average, up 18%. A "Compared with" control overlays Cup Score, Coins or Streak on the same axis.

Mood trends
Each day is classed positive, neutral or negative. Tapping a bar opens that day's own words: "Why did I feel that way?" Affirmations are drawn from the cups eaten on the good days.

Fruit vs veggie split
2F-3V only works if both halves land, and students over-index on fruit. Numbers sit on the graph rather than in a tooltip.
Fruits
↑ 50%
This week you've consumed 50% more fruits than last week.
This week
15 cups
Last week
10 cups
Veggies
↓ 7.7%
This week you've consumed 7.7% less veggies than last week.
This week
12 cups
Last week
13 cups
06 - Impact and next steps
What the design is betting on
Eatopia refuses to treat nutrition as an information problem. It changes the price and the friction, and uses the game layer to carry students across the weeks before the habit pays for itself.
3
barriers addressed structurally: cost, availability, forgetting
2
reinforcement loops layered on one core economic loop
5
interactive flows in the Figma prototype
0
usability sessions run so far, which is the honest gap
Next 01
Test the thing that was never tested
A task-based study of the logging flow, specifically whether Add name then Add photo survives being done five times a day. Photo capture is the likeliest point of abandonment.
Next 02
Validate the economics
The model assumes a university funds the gap between the coin price and the market price. That is a procurement conversation; a pilot with one dining services team and one regional farm would settle it.
Next 03
Widen the sample
Twenty participants found a pattern but could not size it. The disparities research says the students who need this most are the least represented in a convenience sample.
Next 04
Watch the honesty of self-reported logging
Paying coins for logs creates an incentive to log cups nobody ate. The photo step is the current mitigation; whether it costs more in friction than it buys in accuracy is open.
References
01
Nelson, M. C., Story, M., Larson, N. I., Neumark-Sztainer, D., and Lytle, L. A. (2008). Emerging adulthood and college-aged youth: An overlooked age for weight-related behavior change. Obesity, 16(10), 2205-2211.
02
Centers for Disease Control and Prevention. (2017). Only 1 in 10 adults get enough fruits or vegetables. cdc.gov
03
Centers for Disease Control and Prevention. The CDC guide to strategies to increase the consumption of fruits and vegetables. cdc.gov
04
Houghtaling, B., Greene, M., Parab, K. V., and Singleton, C. R. (2022). Improving fruit and vegetable accessibility, purchasing, and consumption to advance nutrition security and health equity in the United States. IJERPH, 19(18), 11220.
05
Conner, T. S., Brookie, K. L., Carr, A. C., Mainvil, L. A., and Vissers, M. C. M. Let them eat fruit! The effect of fruit and vegetable consumption on psychological well-being in young adults: A randomized controlled trial. PLOS ONE.
Eatopia · Promoting healthy eating among young adults
Sashank Mullapudi's Portfolio © 2026-27. Designed by Sashank Mullapudi.