
Introduction
Eating behaviors of young adults between the ages 18 and 25, change once they move out of their homes, into colleges where environmental stressors lead to fluctuating diets. (Rohde1 et al., 2022) CDC states how only 1 in 10 adults get enough Fruit and Vegetable (FV) intake, which is the leading cause of chronic diseases, it states how the intake of 5 portions of FV per day, 2 cups of fruits and 3 cups of veggies, can help reduce the risk of illness and death along with the reduction in heart diseases (Centers for Disease Control and Prevention, 2017).
The aim of the project is to create an application for Young Adults [18-25 years], to help them increase their Fruits and Veggie intake using Gamification. It is primarily designed for users pursuing their undergraduate/graduate degree in an Institution. The application is designed to be in partnership with an Institution, where in return the Institution has a partnership with local farmers to provide subsidized fresh produce to students who are part of the platform. The subsidized product provides students the incentive to be more active in taking steps towards their health.
We approached students from many departments to understand their choices and eating patterns, and received a wide range of responses, such as follows-

Sample survey question to understand students' opinions

Sample survey question to understand their patterns
Understanding & Research
T1-T40 techniques
In Mitchie (2011)’s article “A refined taxonomy of behavior change techniques to help people change their physical activity and healthy eating behaviors”, the 40 techniques of prompt specific goal setting encouraged the user to make changes in their lives, achieving their goals with short-term or long-term plans. Researchers encouraged users to set general goals for their work and life, but more specific goals will help users to make action planning, record daily/weekly data, gain positive results and encourage them to maintain this work style or lifestyle. For example, setting “take more exercise” as the goal, the goal or action planning should involve more details, including, when, where, how long, and times or durations.
3 Fruits & 2 Vegetables
5-A-Day is a byproduct of various national campaigns in developed countries such as the United States, the United Kingdom, France, and Germany, to encourage the consumption of at least five portions of fruit and vegetables each day, following a recommendation of WHO. Up to 2.7 million lives could be saved annually with sufficient fruit and vegetable consumption according to a WHO report. Low fruit and vegetable intake is among the top 10 selected risk factors for global mortality.
University Dining policy
Now that we knew what to implement and to whom, our next question was ‘how?’. We visited the dining services on our campus to propose our idea and understand what the requirements from their end are. After talking to the South Hall Dining Manager, we understood that it is possible to execute the above-mentioned 3F2V plan. Following is the business model with which we started our design phase-

Business Model Canvas
Design Considerations based on Negative Framing
Constant feedback helps to a great extent in Negative Framing, but one key design consideration here is to not let the negative framing turn into a deceptive pattern. This can happen through various means- 1) Guilting users into performing, 2) Words or Phrases that get the job done, but later hurt the individual, and 3) Demotivating to an extent that it starts affecting them psychologically, unknowingly! Negative Framing needs to work as a booster, to show the potential which a user could still explore, and push themselves in a meaningful manner. Constant feedback is a key element in this framing, as it is the primary source of motivation, and the validation attained from ticking boxes or accomplishing targets develops a sense of achievement. Positive Feedback works too in this context, but the results last shorter.
Design
As a team, we had a tough time deciding and hence designing, as each of us come from different backgrounds with our own understandings of empathetic design and health monitoring. This was primarily because each of us was working on an individual project alongside which gave us interesting yet varied learnings on tracking and monitoring. Hence we started with a variety of sketches, and in the later phases, we started to combine the liked parts to sketch out meaningful screens.
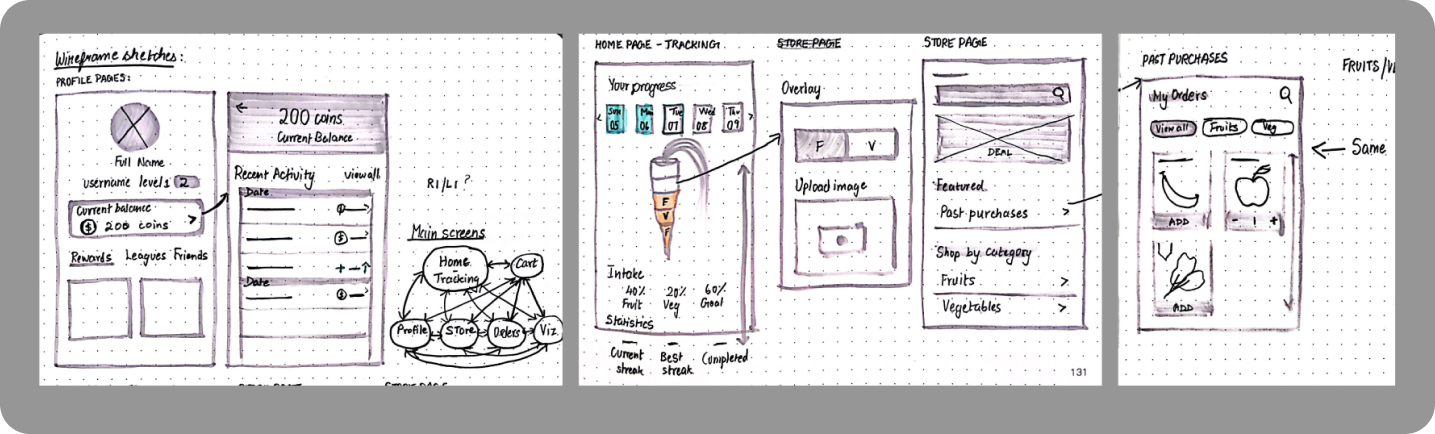
One (of five) set of initial sketches
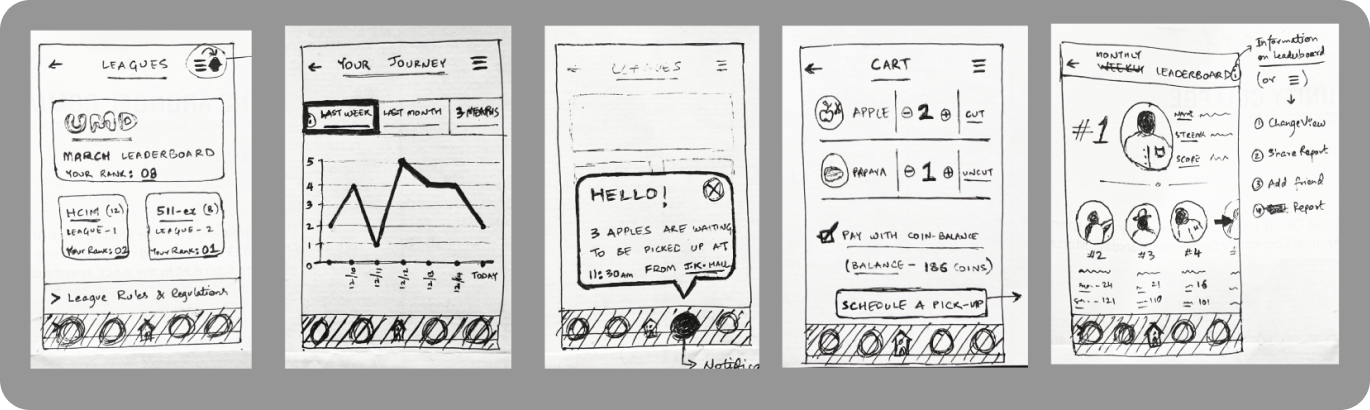
Screen ideas formed from initial sketches
Before getting to Interface Design, we spent some qualitative time on designing the system and process behind the proposal through the lens of a business model, which helped us decide on the stakeholders, and later made the user flow mapping easier.

User Flow Map of Eatopia
Alongside the narrative, research, and interface design, our curriculum encouraged us to explore many different styles of representing the data. Infographics were designed with an intent to make them easily understandable yet dynamic as our users would ideally view them daily. Each set of infographics was tested for usability to ensure all (not just a majority) students are able to comprehend the data.
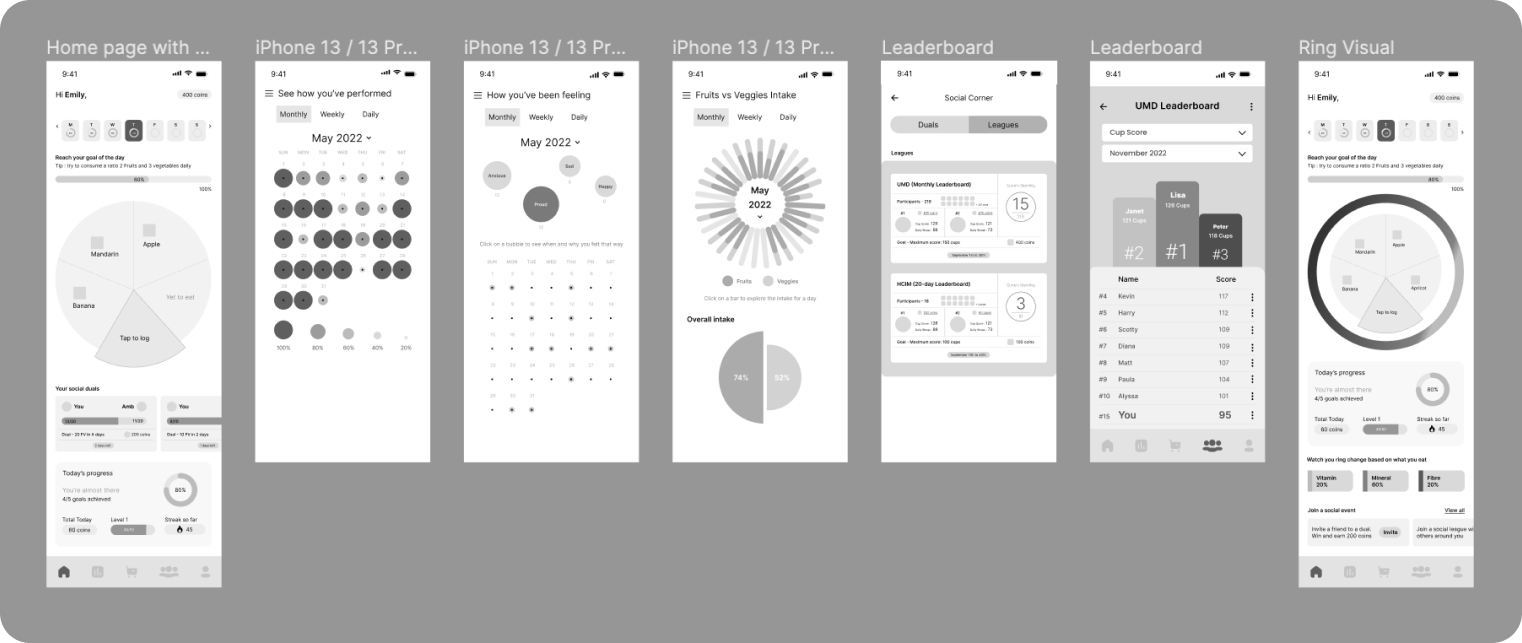
Experiments with infographics for the interface
Having over 70% of our classmates belonging to the young adults category was definitely a major plus, as we could parallelly test our theories and modify our designs along the way. The nature of our project was such that we had the fortune of our classmates constantly providing us feedback as to what they would want out of an application such as Eatopia.

Homescreen of the application
Our design system was based on the themes of Wellness and Healthy practices. Several techniques have been used from Michie’s (2011) T1 – T40 on rewarding to ensure longer engagements of users with the application, and this has been supported by Infographics that do not require much time or attention to comprehend and reflect upon. The social factor was designed keeping in mind a healthy competitive spirit amidst peers, and this was supported by elements such as leaderboards, invites, and rewards associated with them.

Please click on the button below to view the features of the application and the screens designed.
Conclusion and Learnings
We have experimented with both positive and negative framings during our design stage, especially for the social segment, and the results of the prototypes have left us surprised as all our theories were put to question. Our assumption that a positive framing would be much preferred over negative for an application around healthy practices and wellness was proven wrong as majority of the users felt negative framing brought out in them a sense of achievement and kept them motivated to get better with their habits before it is too late.
The prototype stage offered us valuable insights to understand how the infographics were being utilized, both by participants with background in understanding design (cohort members) and those with minimal understanding. Our final screens reflect these learnings and are backed by a psychological understanding of what elements would keep the 18-25 year olds engaged for a longer period of time.
More Projects
UX/UI• RESEARCH • DESIGN

That’s it for now
As a life-long student of design, I’m continuously improving my work. Please look forward to more updates.
I am currently looking for Job Opportunities as a UX Designer, and it would be my pleasure to get in touch with you if you have any opportunities or suggestions for me. Also, if you’re looking for a designer to bounce ideas off of or an enthusiast to go hiking/climbing with, get in touch at mullapudisashank@gmail.com! :)


